
As of today, it's been four years since the last increase in the federal minimum wage, to $7.25 per hour, or $15,000 per year for full-time work.
In the lead-up to this anniversary, CEPR has released four blog posts with infographics that illustrate many different ways to look at the minimum wage at both the federal and state levels – and they all find that the current level, by all measures, is just too low.
Two of the posts compare the current minimum wage against various benchmarks, such as inflation and workers' average productivity, age and education. For example, if it had kept up with inflation since its peak in 1968, the federal minimum wage would now be $10.75 an hour. And if the minimum wage had grown along with workers' productivity, it would be as high as $17.19 today.
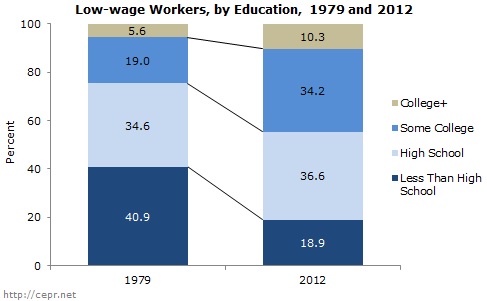
Also, today's low-wage workers are older and better educated than in the past, and all else equal, older and better-educated workers earn more than younger and less-educated workers. Had the minimum wage kept pace with low-wage workers’ age and educational attainment, it would be at least 9 to 14 percent higher than if it were adjusted just to rise in step with inflation.
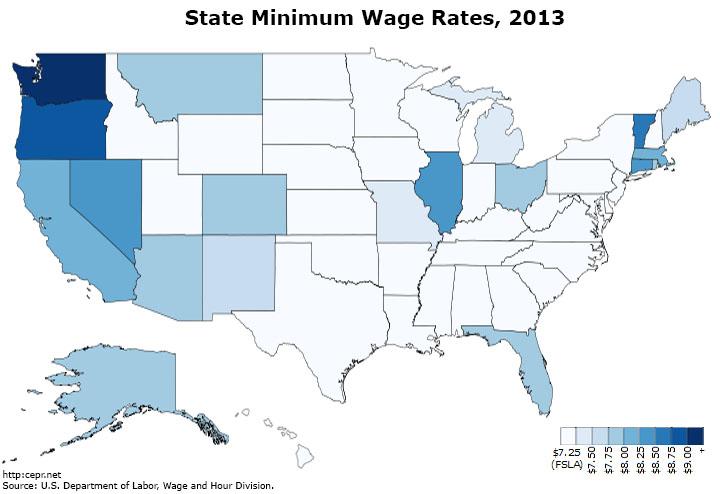
The other two posts look at how states have taken matters into their own hands, featuring color-coded maps and tables showing the different minimum wages for regular and tipped workers in the states. For the regular minimum wage, 19 states have raised theirs above the federal level, and 10 of them decided to make their state minimum wages automatically keep pace with inflation, something that federal level doesn't do.
The final post focuses on the much-lower minimum wage for tipped workers. The federal minimum for these workers (such as waitstaff, hair stylists and car washers) is only $2.13 an hour, a level that hasn't been increased in 21 years. However, 31 states have higher minimum wages for tipped workers, and seven have set the tipped worker minimum at the same level as that for non-tipped workers.
CEPR's also put together a couple of printable flyers summarizing these posts: one looking at the federal minimum wage and the other focusing on the states (and including bar graphs of the state minimum wages that aren't seen in the blog posts).
Click here for a list of all of our most recent research on the minimum wage.
Nicole Woo is director of domestic policy at the Center for Economic and Policy Research
